
In the fast-paced world of project management, the ability to monitor performance effectively is paramount. As organizations strive for innovation and efficiency, traditional methodologies can sometimes fall short in addressing the complexities of modern initiatives. One such method, Earned Value Analysis (EVA), has long been recognized for its rigor and depth but may prove cumbersome for many project leaders. As an alternative, Milestone Analysis offers a simplified yet equally effective means of tracking project performance. This article aims to explore the validity of Milestone Analysis as a viable tool for performance monitoring, delving into two specific graphical tools that aid in its implementation: the Milestone Prediction Chart and the Milestone Analysis Chart.
What is Project Performance and Why is it Important to Monitor It?
Project performance encompasses various dimensions, including the achievement of defined objectives, adherence to timelines, adherence to budget constraints, and maintenance of quality standards. These elements collectively determine the success or failure of an initiative. Monitoring project performance is crucial for several reasons. Firstly, it enables teams to identify potential problems early, allowing for timely interventions that can prevent minor issues from escalating into significant setbacks. This proactive approach not only ensures the achievement of objectives but also optimizes resource allocation and utilization.
Furthermore, stakeholders are often keenly interested in the health of a project, making it essential for project managers to keep them informed. Regular performance reviews facilitate transparent communication, which in turn builds trust and confidence among stakeholders. Lastly, by visualizing trends and making predictions based on gathered data, project leaders can maintain a strategic overview, enabling better decision-making as the initiative progresses.
Factors That Affect Project Performance
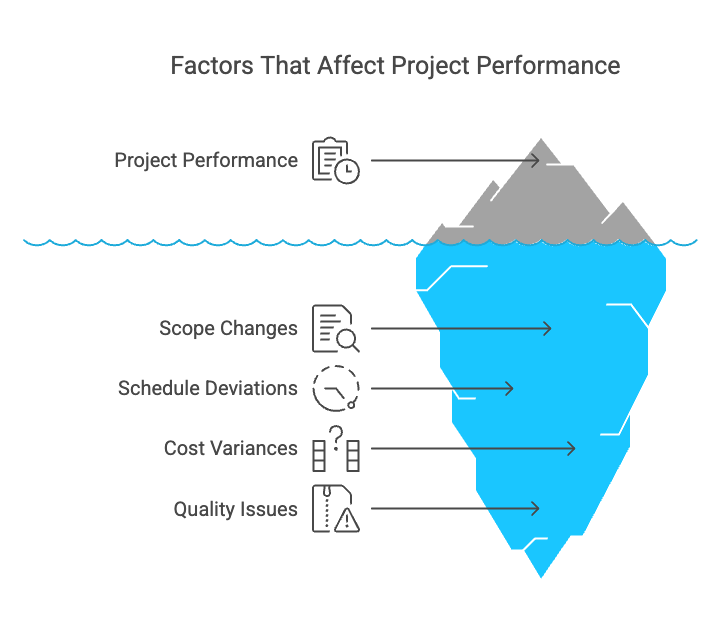
Numerous factors can significantly influence project performance, and understanding these interconnections is vital for effective management. Scope changes can trigger a ripple effect, leading to deviations from the initial schedule and corresponding cost variances. When requirements shift, teams often find themselves racing against the clock to adjust deadlines and resources, which can result in unforeseen risks and quality issues.
Additionally, schedule deviations can stem from a variety of sources, including team capacity overestimation, unexpected delays in deliverables, or mismanaged dependencies. Cost variances may arise due to miscalculations during the planning phase or unexpected expenditures needing to be addressed. Lastly, quality issues often arise as a result of rushed deliveries or inadequate testing, leading to a potential compromise on the project’s integrity. Recognizing the interconnectedness of these factors is essential in maintaining a cohesive approach to performance monitoring.
Adjustments to the Baseline and Consequences on Cost and Schedule
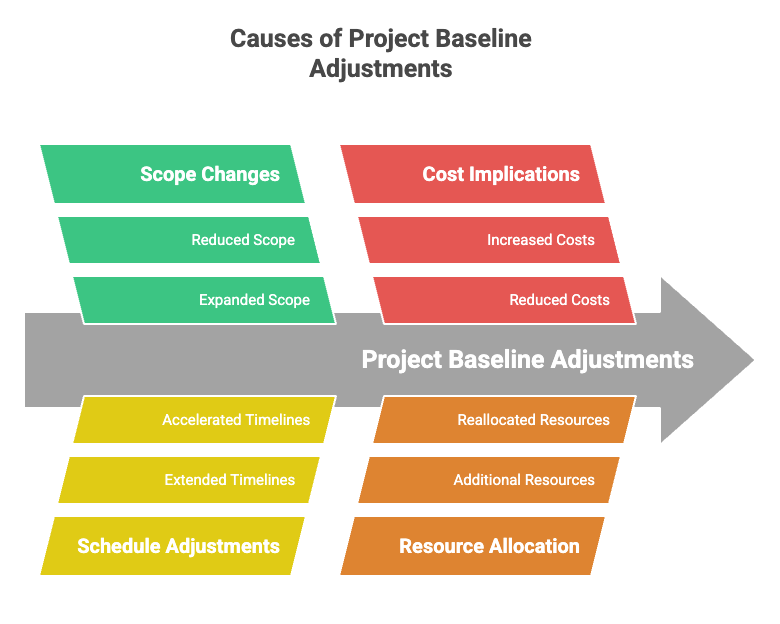
As project initiatives unfold, changes to project components such as scope, schedule, and budget may become necessary. These alterations often require adjustments to the established baseline—a critical reference point for measuring progress. For instance, an expanded scope may necessitate additional resources, resulting in increased costs and extended timelines. Conversely, strict adherence to the original baseline in the face of significant change could jeopardize the project's success.
The consequences of adjusting the baseline can cascade throughout the initiative. When cost or schedule adjustments arise from scope changes, they can significantly impact cash flow and resource allocation. Effective project management, therefore, demands a flexible yet disciplined approach, ensuring that any required changes are thoughtfully considered and executed in conjunction with ongoing performance assessments.
Simplifying Monitoring with Milestones
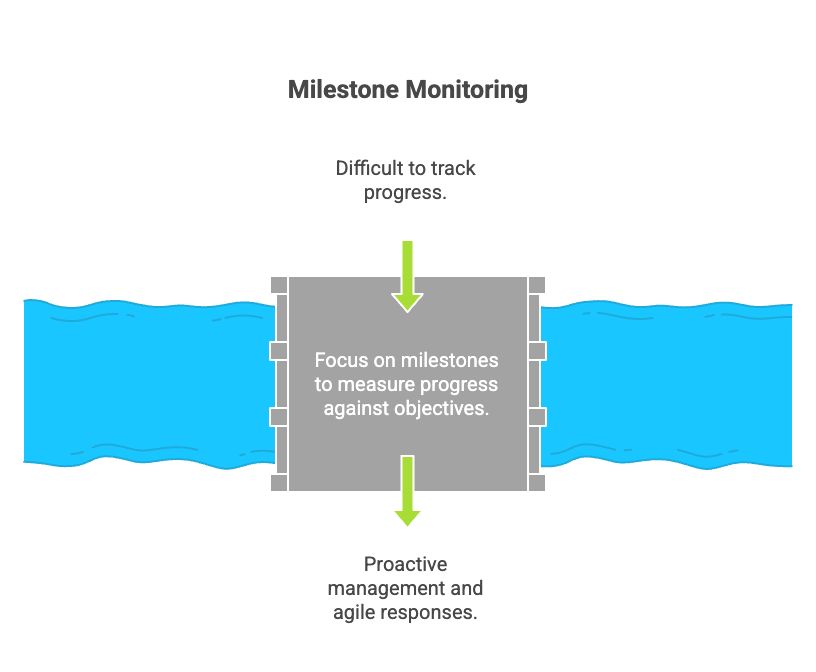
One effective way to simplify the monitoring of time and cost is by focusing on key milestones throughout the initiative's lifecycle. Milestones serve as concrete control points that enable teams to measure progress against predefined objectives. As tangible reference points, they allow project managers to monitor advancement or deviations efficiently. The simplicity of referring to milestones makes the process less daunting, especially in complex initiatives where multiple components interact.
Moreover, by emphasizing milestones, teams can accelerate the identification of deviations. If a milestone is missed, project leaders can promptly assess the reasons and implement corrective measures without waiting for a comprehensive performance analysis. This early detection proves invaluable, allowing for more agile responses and adjustments, thereby fostering a culture of proactive management.
Graphical Tools for Measuring Project Performance
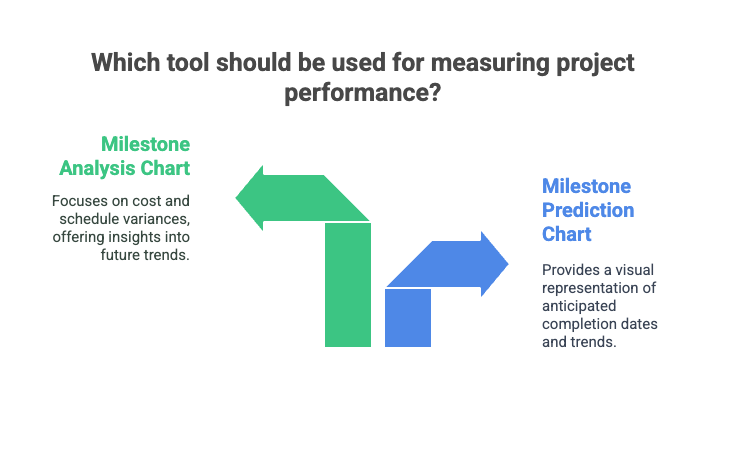
Graphical representation of data can significantly enhance an organization’s ability to analyze performance metrics. Two pivotal tools in Milestone Analysis are the Milestone Prediction Chart and the Milestone Analysis Chart. Through visual aids, project leaders can interpret performance patterns, predict future outcomes, and communicate their findings effectively to stakeholders.
Milestone Prediction Chart
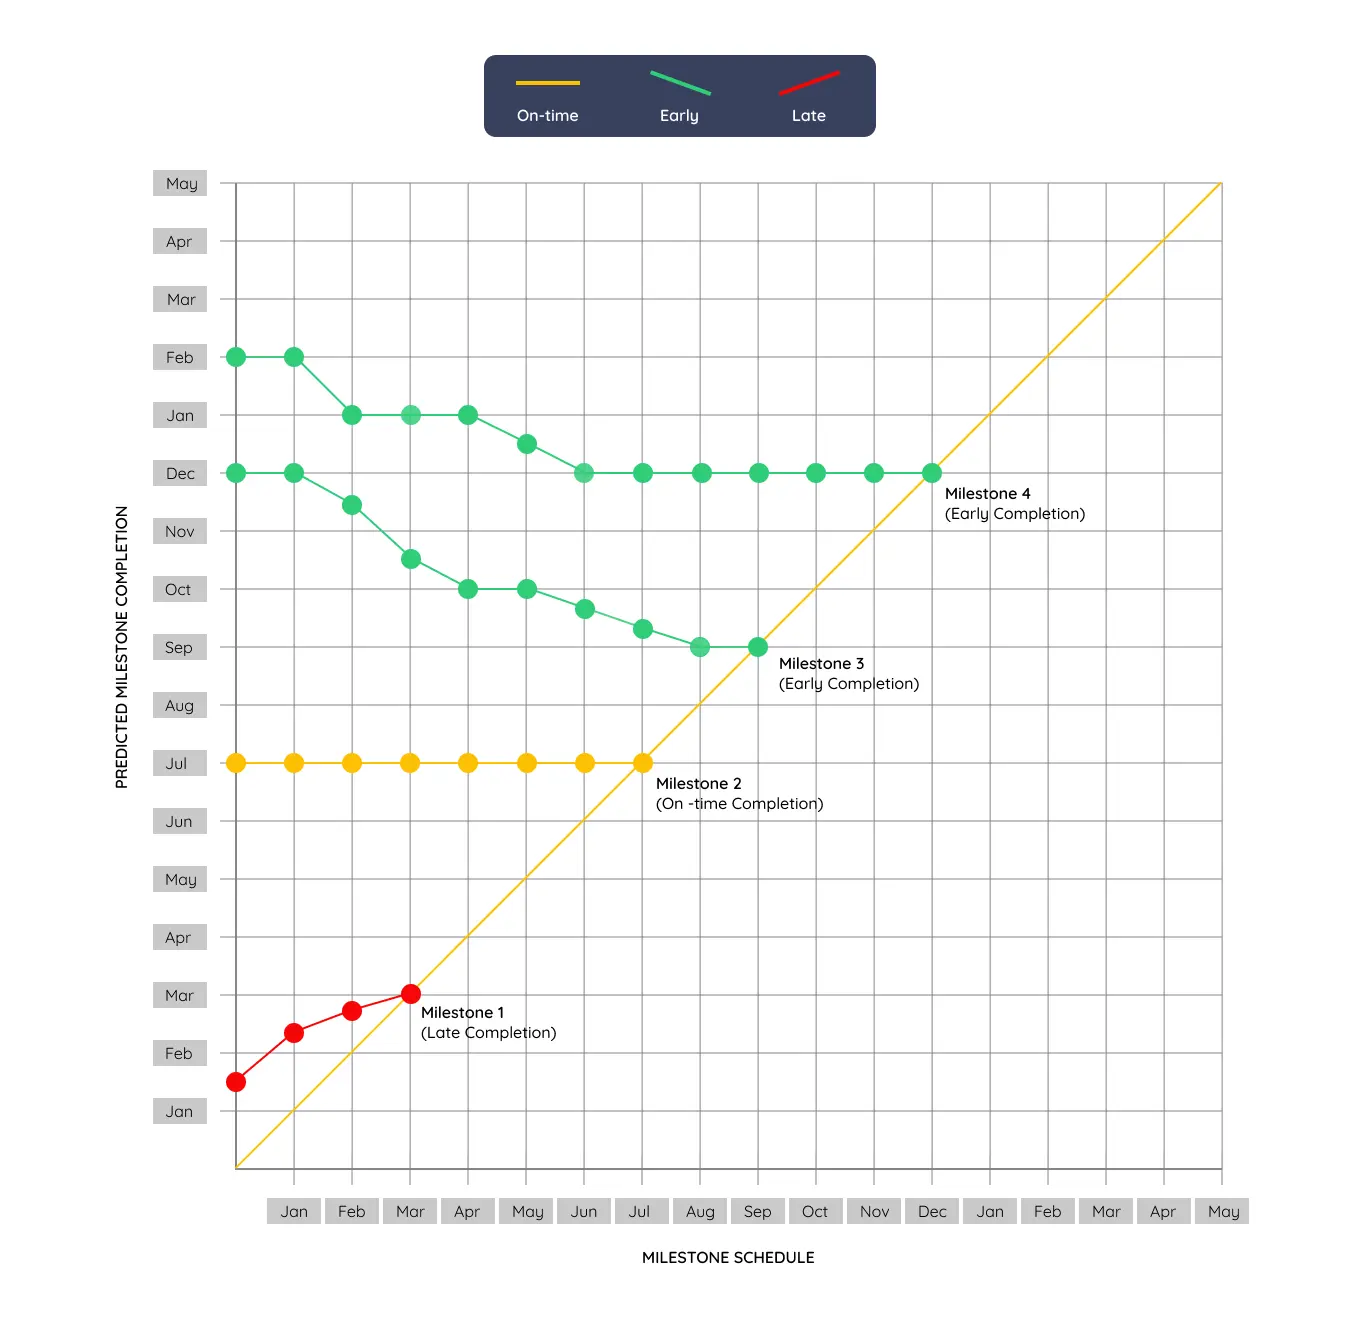
The Milestone Prediction Chart offers a clear visual representation of the anticipated completion dates of various milestones. On the vertical axis, teams plot the completion dates for specific milestones, while the horizontal axis denotes the date predictions were made. Both axes utilize the same project schedule timeline, resulting in a 45° line that represents planned milestone completion. To utilize the chart effectively, teams first establish baseline milestone dates on the vertical axis.
During regular project meetings, teams can assess the status of each milestone, recording the anticipated completion dates. As updates are added over time, the resulting lines can reveal trends in milestone completion. A slope of zero indicates that the milestone is on track, while a negative slope suggests early completion, and a positive slope signals delays.
Plantilla de Gráfico de Predicción de Hitos gratis
Free Milestone Prediction Chart Template
Milestone Analysis Chart
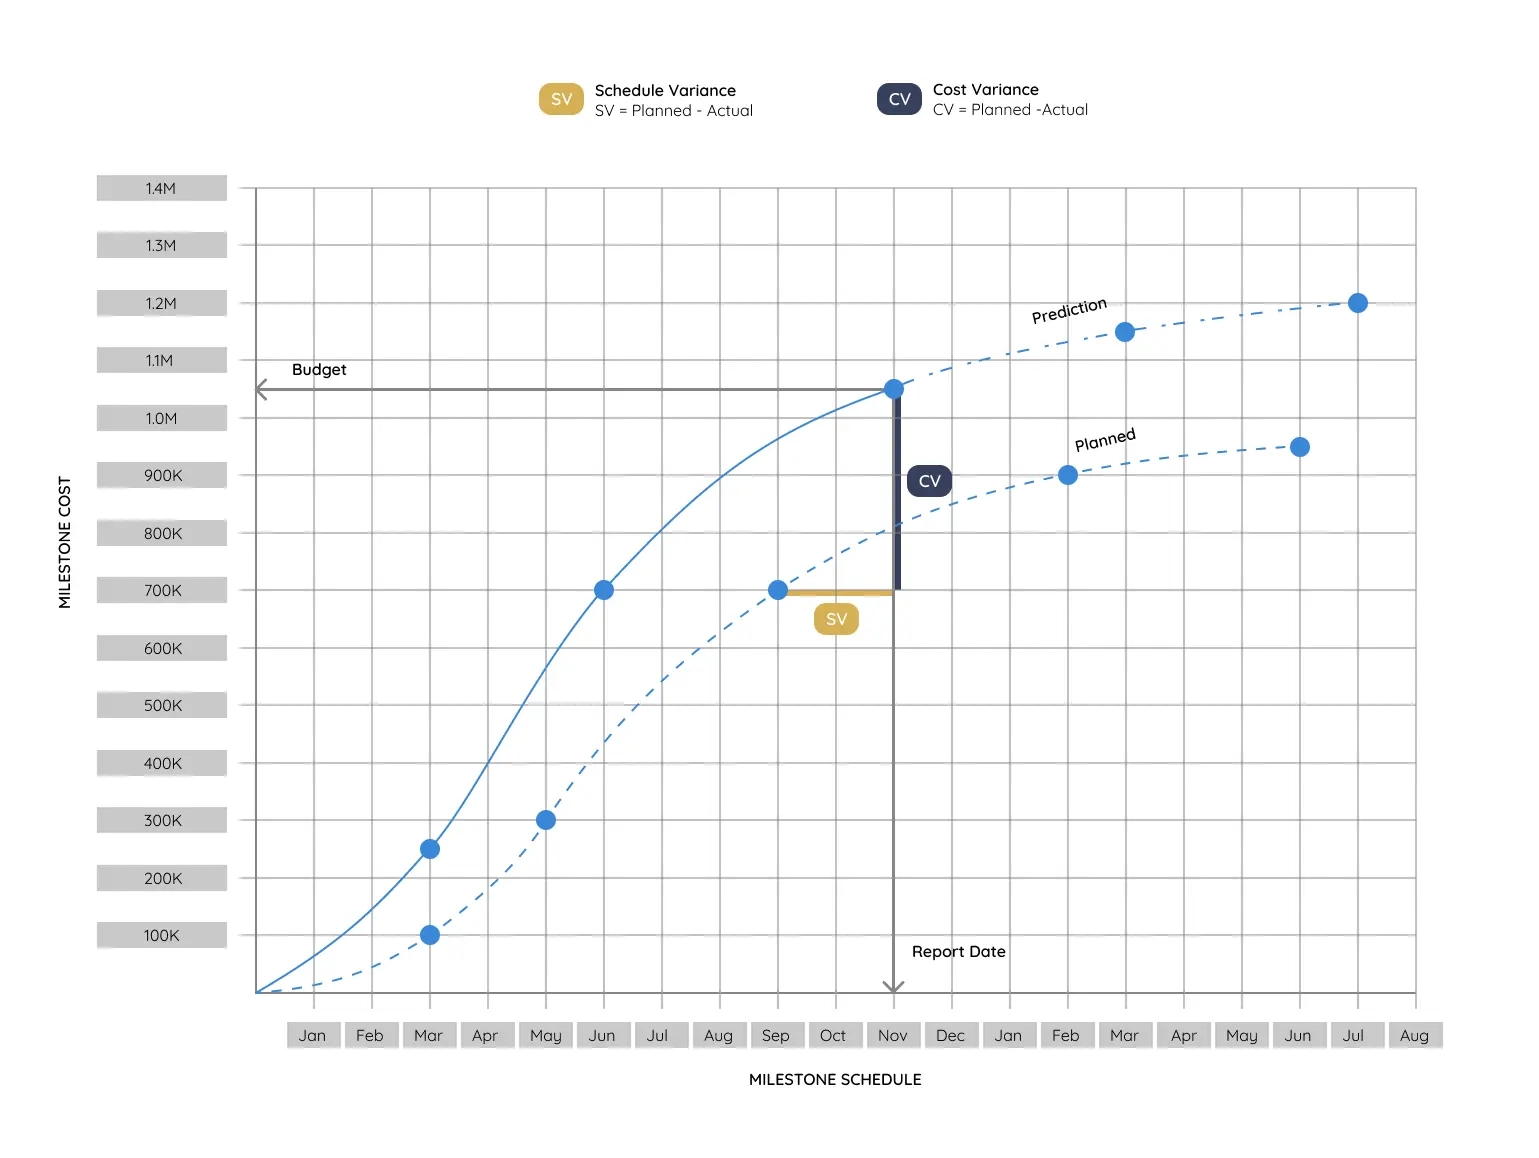
The Milestone Analysis Chart serves as an alternative to traditional Earned Value Analysis by focusing solely on two critical data points: milestone cost and milestone schedule. To effectively implement Milestone Analysis, teams first chart all milestones according to their planned completion dates on the x-axis, while costs are plotted on the y-axis. Subsequently, actual completion data is superimposed to evaluate performance.
In time, the differences between planned and actual values on both axes reveal essential insights. The vertical difference indicates cost variance, while the horizontal difference represents schedule variance. As teams continue to update the analysis after each meeting, extrapolating the trends for incomplete milestones can yield valuable predictions regarding future costs and scheduling for the entire initiative.
Plantilla de Gráfico de Análisis de Hitos gratis
Free Milestone Analysis Chart Template
Advantages of Milestone Analysis Over Earned Value Analysis
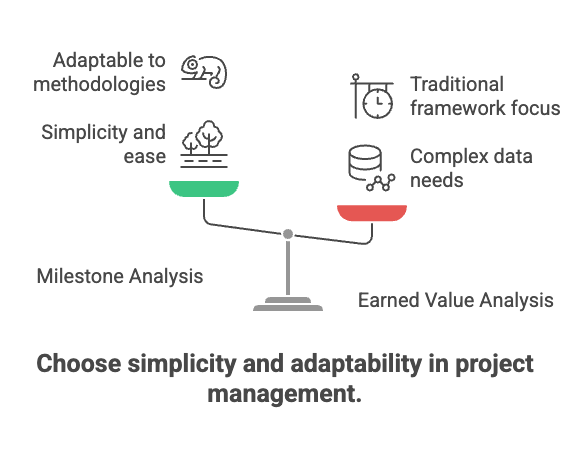
One of the key benefits of Milestone Analysis is its inherent simplicity compared to Earned Value Analysis. While EVA requires extensive data collection and complex calculations, Milestone Analysis streamlines this process significantly. With minimal data requirements, teams can quickly understand current project status and visualize trends without the steep learning curve associated with traditional performance monitoring techniques.
Milestone Analysis is also adaptable, making it suitable for various project methodologies, including agile, hybrid, and traditional frameworks. Its straightforward nature allows project managers to focus on actionable insights rather than getting bogged down in intricate calculations. This characteristic makes it a versatile tool for leaders seeking efficiency without compromising the integrity of their performance assessments.
Key Takeaways
In summary, monitoring project performance is a crucial endeavor that can significantly impact an initiative's success. Milestone Analysis emerges as a promising alternative to Earned Value Analysis, providing a simplified yet effective solution for performance tracking. With graphical tools such as the Milestone Prediction Chart and Milestone Analysis Chart, project leaders can visualize trends, predict future outcomes, and communicate results effectively.
The advantages of Milestone Analysis not only contribute to ease of use but also ensure its relevance across diverse project settings. As leaders in the field of project management, adopting this method can enhance overall performance management, ultimately enabling the successful delivery of initiatives.